Love Quin Inventory Dashboard: buying decisions backed by numbers, not gut feel.
The challenge
Square shows what sold, but not how well inventory is performing. Buying and markdown decisions rested on gut feel, and a healthy overall number could hide a vendor or category that was tying up cash.
What we built
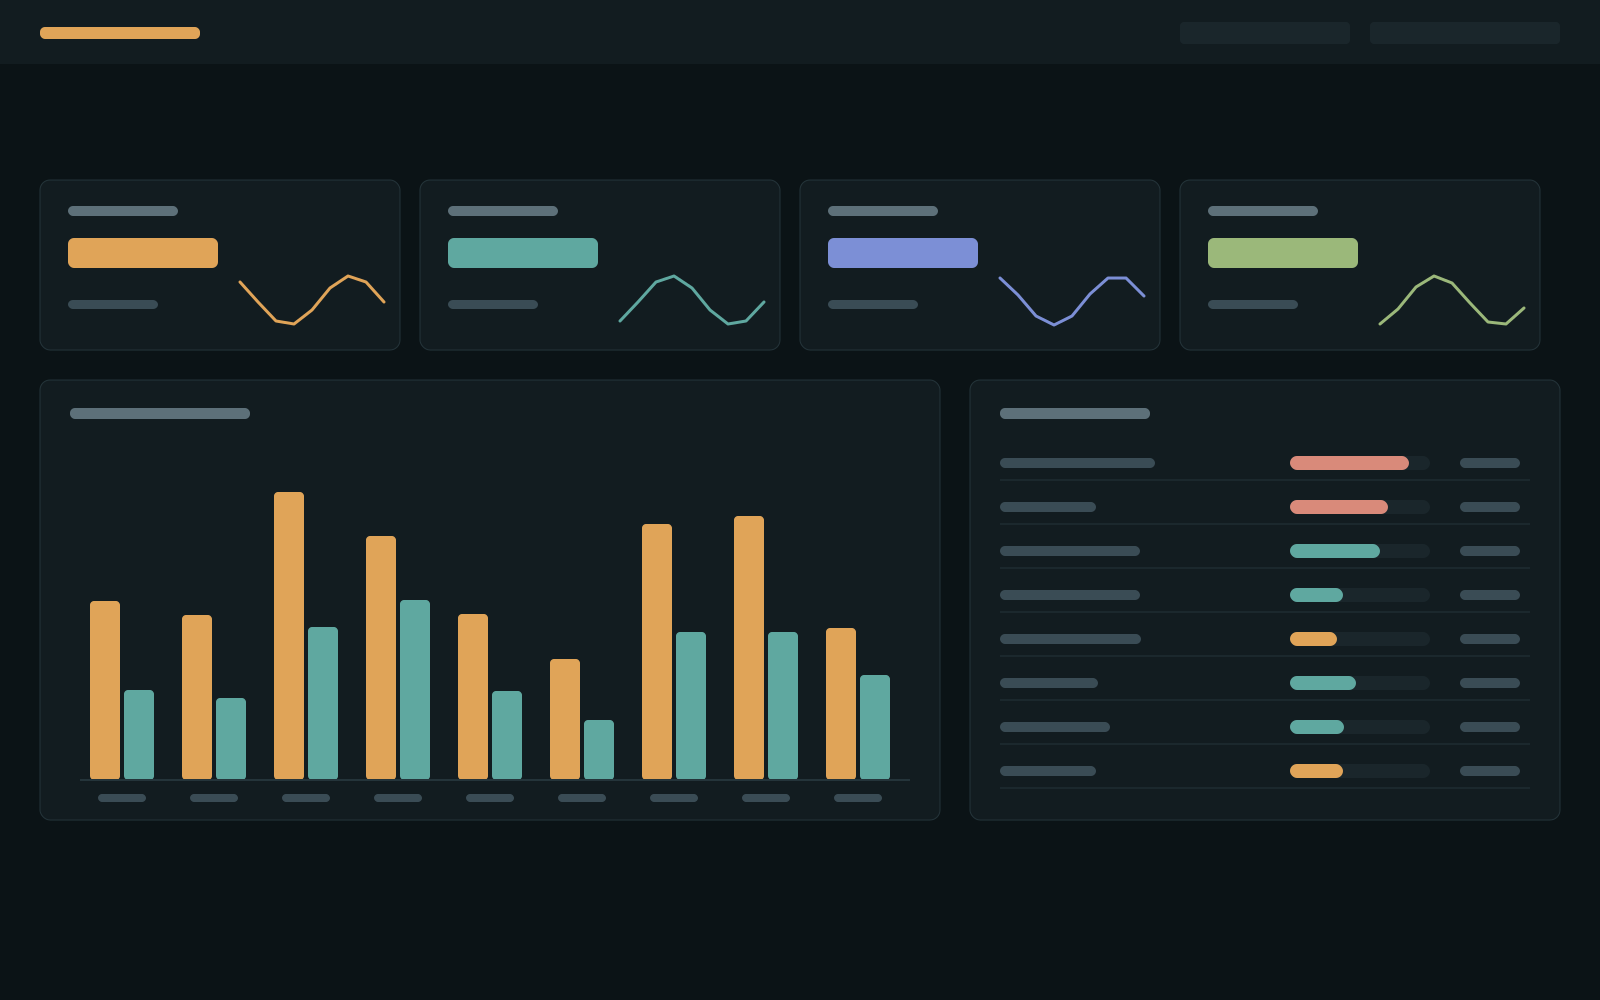
A password-protected dashboard built around two numbers: how much margin each dollar of inventory earns, and how often inventory turns over. Both break down by category, vendor and price point for any date range. Live sales come straight from Square, the math runs in the browser with no per-use AI cost, and the owners sign in at a normal web address.
The results
The buyer now uses the dashboards at buying shows to purchase by categories proven to sell, and inventory turnover has increased 127% year over year.
Got a problem like this one?
Tell us what you’re working on. We’ll show you what it takes and what it costs.
Submit a request